
The US economy continues to grow in a Global slow growth environment. The stock market pullback in January and February was an excellent opportunity for investors to buy stocks at a discount. Both U.S. presidential candidates express a need to invest in US infrastructure such as ports, roads and bridges. Government spending on infrastructure should provide economic stimulus over the next few years. The Federal Reserve is likely to increase interest rates and this will cause a volatile move in the financial markets. The Fed is starting from a very low level. It will be quite some time before interest rates rise enough to cause a slow-down in the real economy. Inflation is subdued and the Fed is cautious about raising rates.
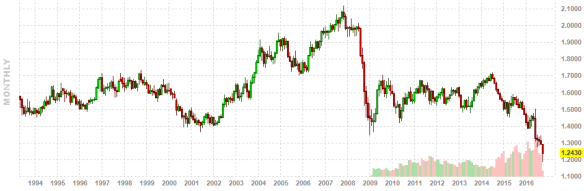
Central banks in the USA, Japan and Europe have continued to provide a low interest rate environment. Banks and other financial institutions are typically required to hold a portion of their assets as government bonds. In Europe, the Central bank has been buying European government bonds and the bonds of large companies. This has resulted in banks, insurance companies and pension funds buying bonds with extremely low or negative interest rates. This is meant to stimulate the European economy but is an experiment. The British vote to leave the European Union adds more uncertainty to the financial industry. Theresa May, the new British prime minister, announced that the U.K. will begin the exit process in the first quarter of next year. The British Pound broke a new price level this week and continues its slide downward against the U.S. dollar and the Euro. The graph below shows the plunge of the Pound vs the US Dollar. The graph covers 23 years and the right side shows the Pound dropping over the last six months.
G.B. Pound vs. U.S. Dollar:
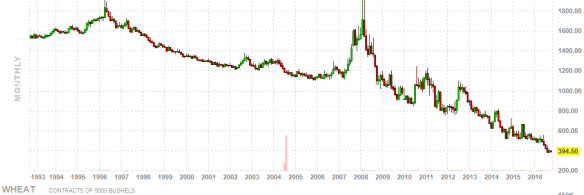
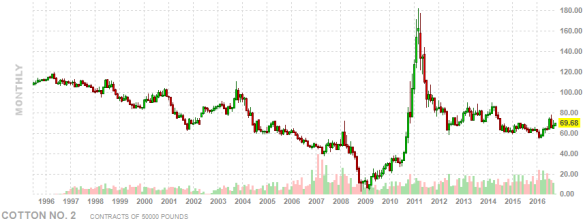
It is interesting to look at price trends over the last 20 years. Commodity prices such as oil, gas, wheat, rice and cotton fell dramatically.
Crude Oil:

Natural Gas:

Wheat:
Cotton:
Clothing costs declined over that period due to low-cost imports and automation. Medical costs and other consumer service costs went in the opposite direction and doubled over the period.
How have stock investments performed over this period? It is instructive to look at the performance of the advanced economies of the U.S.A. and the Euro zone. America’s S&P 500 stock index was stagnant from the year 2000 to 2012 reflecting the two big recessions in 2000 and 2008. The stock index is now in an up-trend and has hit new price highs.

In contrast, the top 50 European stock index, priced in Euros, is still in a trading range. It is at the same price level as it was in 1998, eighteen years ago. America has a dynamic economy. The rising equity market is a good indicator of America’s strength.
Euro Stoxx 50 index:

The companies we invest in are typically valued at a low price to their earnings and relative to the market and historically these types of companies appreciate well. Many pay high dividends which is great in this low interest environment.
